

- Curriculum Design
- Data Analysis & Visualization
- Federally-Funded Open-Source, Open-Access XML Database: Literature in Context
- Dramaturg & Co-Producer: Theater
- Social Media & Web Manager
- Writing Samples
Curriculum Design
Articulate Storyline
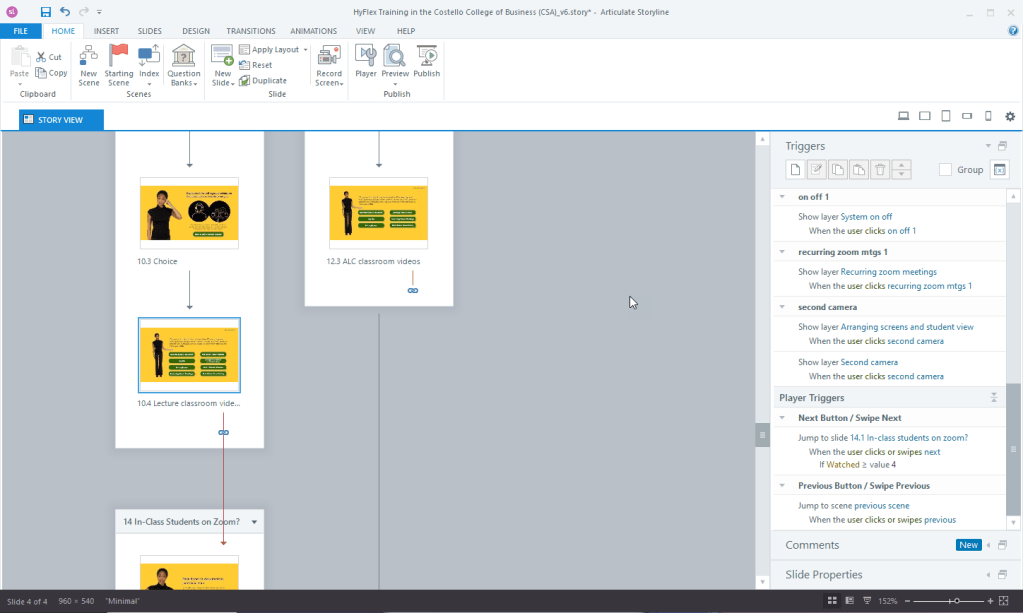
This 30-minute required training for faculty teaching in the hy-flex modality, as well as students serving as Classroom Support Agents, showcases my Storyline skill. This example of Storyline contains a quite restricted branching structure, as well as iterating variables, hotspots, embedded videos, a robust resources collection, and a question bank pull. Completion is set at 75% of slides viewed. A branded Storyline theme was also developed as a part of this project.
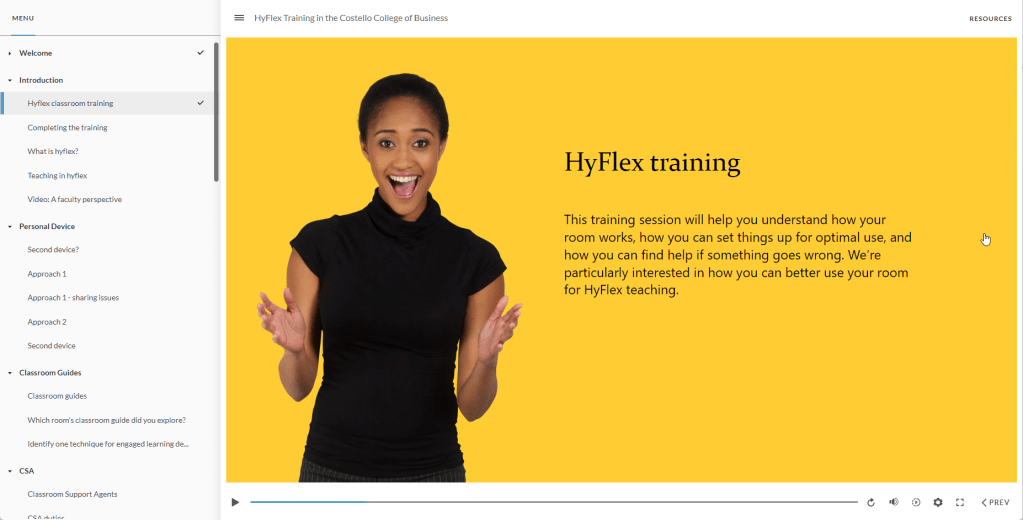
Training was shared both as a public SCORM in Reach 360 as well as in the private Canvas LMS. Clicking this link will take you to the live course on Reach 360.
Rise
Showcasing my curriculum design skills, this Articulate 360 Rise course adapts materials I developed for a 3-credit university course in Digital and Nonlinear Storytelling, eliminating grade requirements and focusing instead on completion. You can read my perspective about the crosswalk from higher ed to professional curriculum design here. My target audience for this training module includes new members of a sales team who need to get up to speed on how to tell a good story, or to understand their company’s culture of storytelling. I also hope it shows how my experience in higher education can be translated to new contexts. Interact with the live site here.
H5P Interactives
Below are several examples of H5P interactives. [TBU]
Teaching Workshop: Wikipedia
Data Analysis & Visualization
This Wikipedia in the Classroom session seeks both to debunk some myths about Wikipedia and introduce some more interesting and critical ways (in low stakes contexts) you can use it to build writing skills and information literacy in your classes.
Static Site-Specific Installation and Gephi Network Analysis: When Your Darlings Bite Back
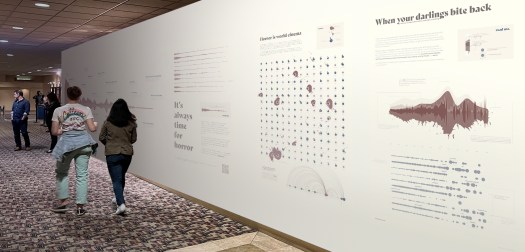
This project, my capstone for MICA’s Data Analytics and Visualization graduate program, visualizes the shape of feature-length horror film, particularly horror about art subjects, as described in IMDb from 1900-2020. It takes the form of an interactive network visualization, as well as three 2D visualizations imagined as vinyl wraps in an arthouse cinema. Carol Clover (1992) writes that “[a] strong prima facie case could be made for horror’s being…the most self-reflexive of cinematic genres” (168). I wanted to test this with data, by extending her observation to its logical conclusion: horror is also, then, about the act of making, creating aesthetic objects or experiences, often through the rubric of unmaking. Throughout the project, I used Python, R, Tableau, Tableau Prep, Gephi, and Illustrator. Read more. View the interactive network analysis here.
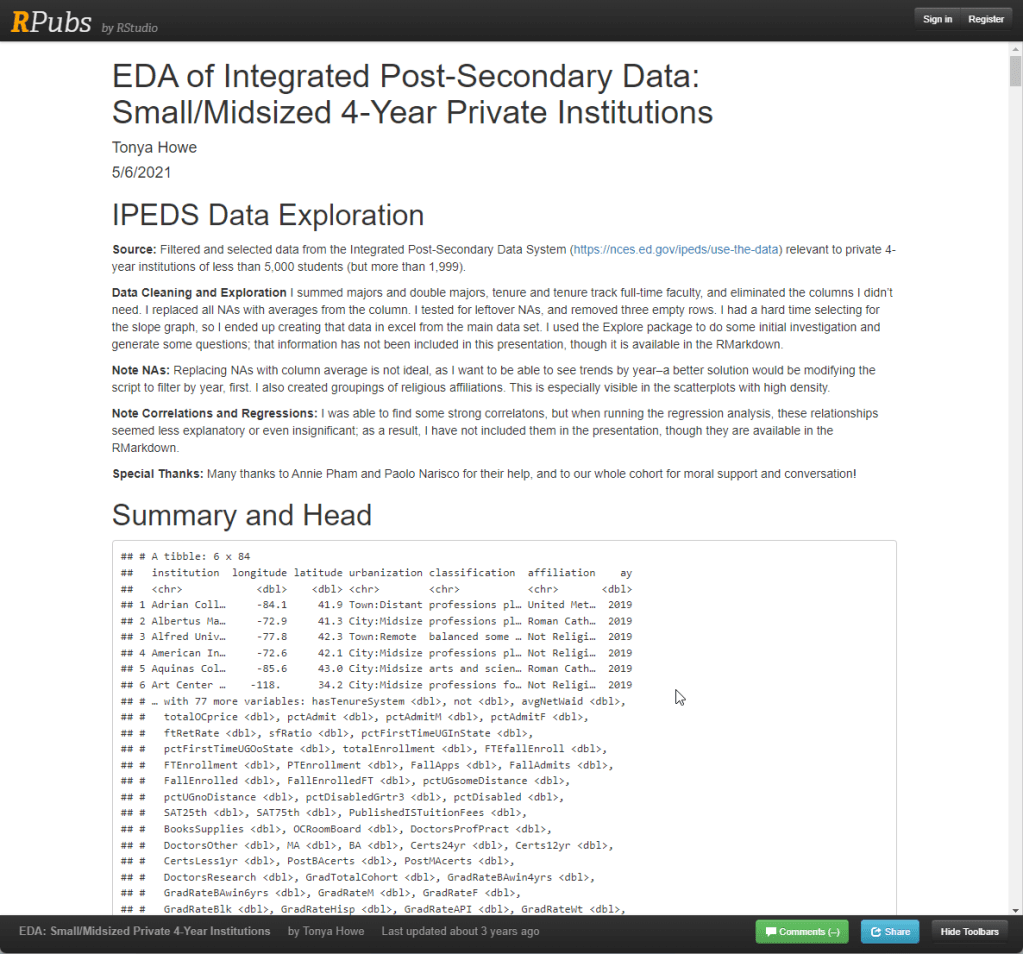
R-Studio: EDA on 4-Year Private Institutions in the US
What can we learn about the landscape of higher education in the US among mid-sized 4-year private institutions from IPEDS data? Made in R-Studio and published on RPubs, this EDA draws on federal IPEDS data reported by institutions of higher education and housed in the National Center for Education Statistics.
ArcGIS: Mapping Food Insecurity in DC
This interactive StoryMap, made in ArcGIS Online explores food insecurity in the District of Columbia. It draws on multiple data sources, from the Census to DC’s Open Data materials.
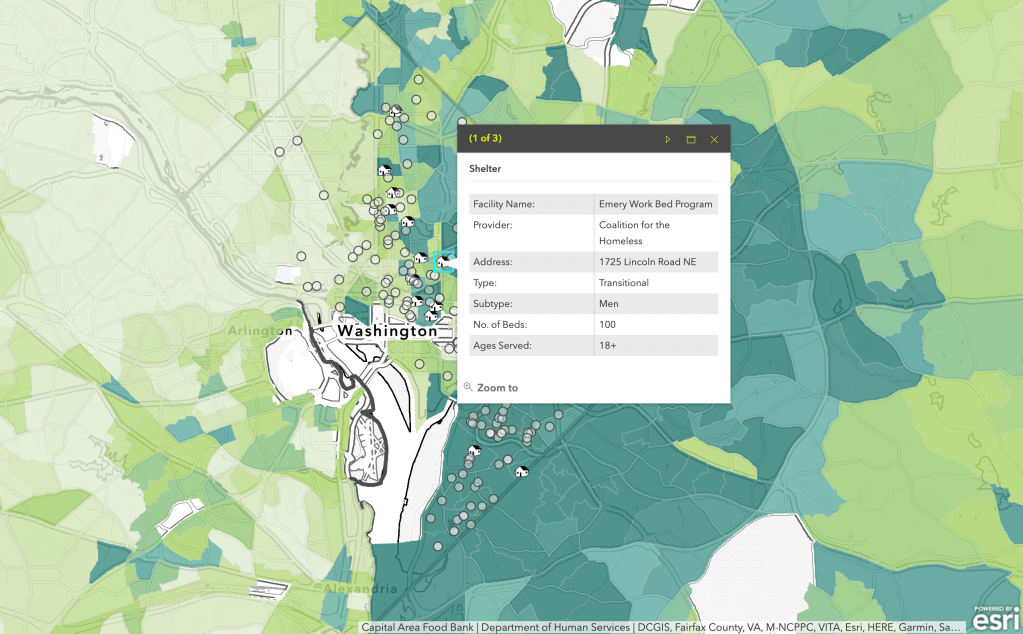
Tableau Dashboards: A Selection

Interactive Dashboard: Getting Creative with the Economy: This tableau dashboard is useful for grant-seeking organizations in the creative economy, giving both an overview of the creative sector and a sense of some of the racial and wealth disparities that shape it. Because of the great disparities in wealth and unemployment throughout the city, I used neighborhood-specific data. I wanted to learn how businesses and employment in the creative sector differed across the city, and provide organizations an opportunity to see the contextual factors of race and wealth.
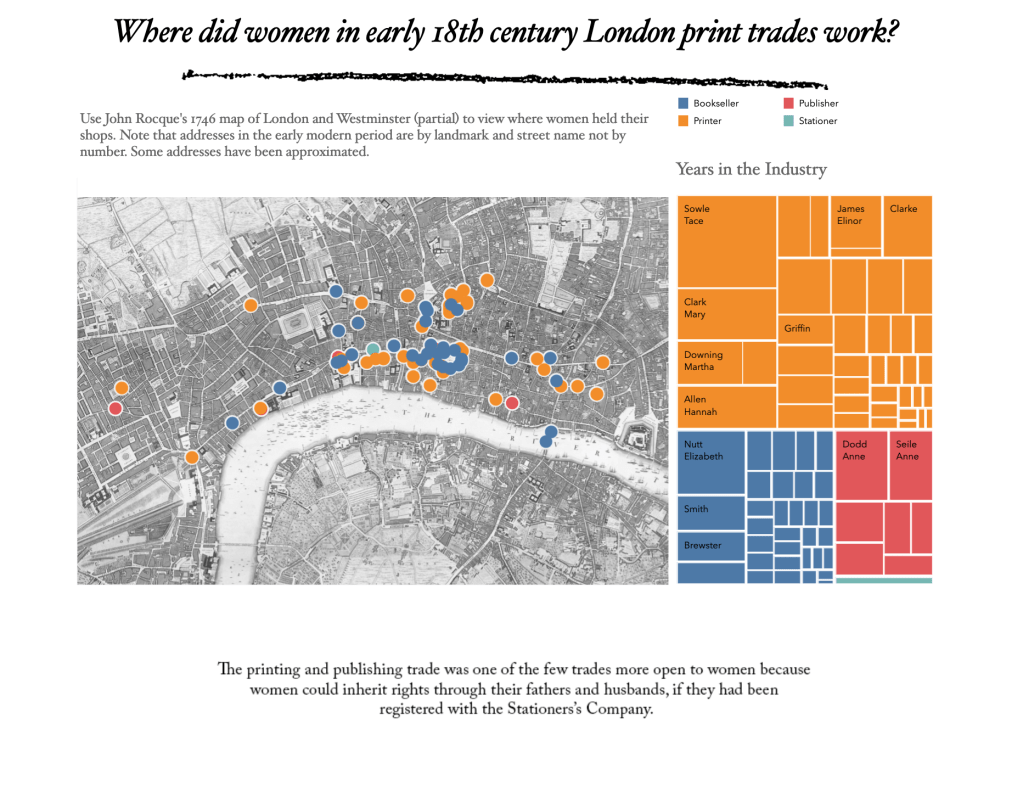
Interactive Geospatial Dashboard: Where did women in early 18th-century London print trades work?: For this geospatial analysis project, I wanted to learn more about women printers in the early eighteenth century—I was really interested in using a historical map, and this seemed like an interesting avenue. Where did women in the print trades work? How many were there? Were they located centrally, or marginally, geographically speaking? I did not have a pre-existing data set, so I created my own of about 60 printers, publishers, and booksellers from about 1680-1750 by compiling the data. Sources included two digital projects based on early modern maps–Locating London’s Past and The Grub Street Project, which helped me navigate early eighteenth-century London and find the cross-streets and addresses.
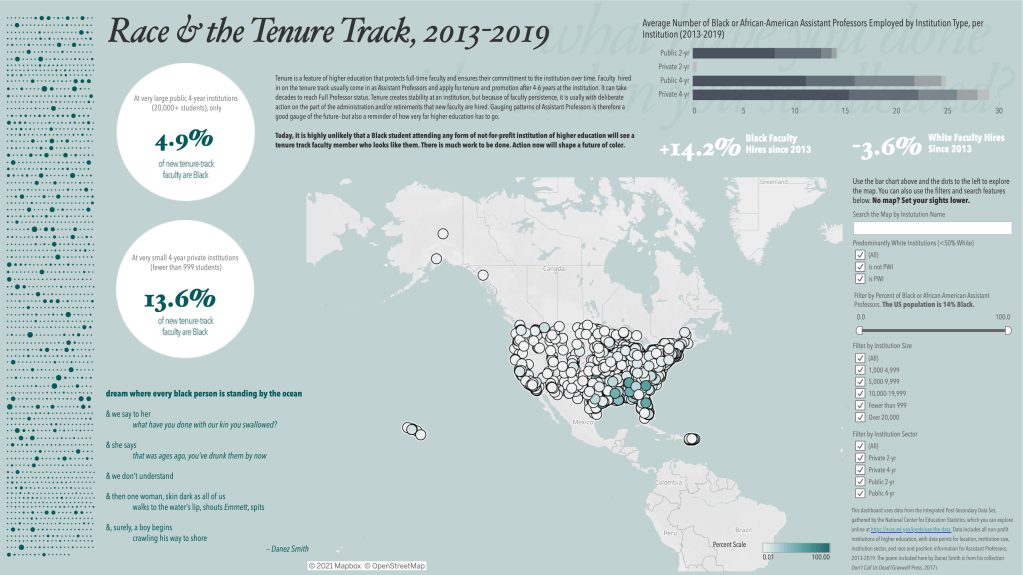
Interactive Dashboard: Race and the Tenure Track, 2013-2019: I currently work in higher education, and recently read the Chronicle of Higher Education interactive story “How Many Black Women Have Tenure on Your Campus?” Since I’ve done some data analysis with the Integrated Post-Secondary Education Data Set, I thought I would reprise this idea focusing specifically on Assistant Professors on the tenure track, which is a good gauge for the future—it can take decades for an Assistant Professor to become a Full Professor through promotion, and these faculty apply for tenure usually between 4-6 years after starting as an Assistant Professor. I wanted to explore the pipeline.
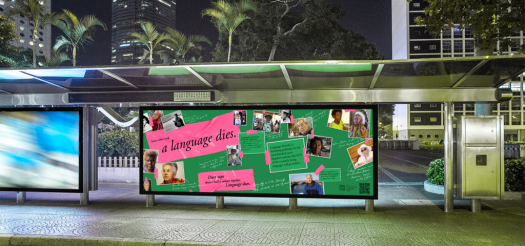
Photographic Data Visualization: #LanguageDeath
Advocacy Campaign on Language Death: An advocacy campaign for bus shelters and other large spaces that uses QR codes to connect the audience with more information. The images are all last native speakers of their language.
Federally-Funded Open-Source, Open-Access XML Database: Literature in Context
Awarded over $400,000 in state and federal grants, Literature in Context is an XML database application providing curated, edited, and annotated OER materials for teachers and students in an easy-to-use and accessible format focused on usability in the classroom.
See our 2018 lightning talk at the NEH Office of Digital Humanities project directors event. Made with eXist-db, Oxygen, and GitHub. Read more about the goals of this project at Eighteenth-Century Common or through a 2022 presentation, below. Visit the live site here.
Dramaturg & Co-Producer: Theater
In summer of 2016, I worked with colleagues across Washington, DC, to develop, produce, mount, and launch a 2-week theatrical run at Atlas Performing Arts Center as part of Capital Fringe. I served as dramaturg, helping our performers, musicians, and director understand the historical context of the story. As co-producer, I also auditioned actors, provided rehearsal space, and ran lights. How to Give Birth to a Rabbit. Sprenger Theatre, Atlas Performing Arts Center. Capital Fringe 2016. Review, DC Theatre Scene. Review, DC Metro Theater Arts.

Social Media & Web Manager
From 2008-2012, I developed and managed our department web presence on WordPress.com, before migrating to a university-wide server installation of WordPress. I worked as one of the key voices that successfully advocated for a university-wide multisite installation for student, faculty, and university unit needs, both within the classroom and without. Since approximately 2016, I have been the chief web manager for three program pages (and numerous subpages) on the Kentico CMS system, including those for the Department of Literature & Languages, the B.A. program in Digital Writing & Narrative Design, and the M.A. program in English & Humanities. From 2006-2009, I managed a small hand-designed web presence for the department using Dreamweaver. Our current university-wide website uses WordPress.
Since 2012, I have managed the department’s social media accounts across Facebook, extending from there into Twitter, Instagram, and LinkedIn. In 2017, I consolidated our orphan Facebook groups and profiles, linking them to a single page. In the past two years, I have linked our regularly-used accounts via HootSuite, to simplify management and scheduling of posts. I set up and contribute to a departmental YouTube account and maintain a Flickr Pro account for visual archive management. I train and supervise student workers who assist with our social media presence.
Marymount University Websites for: English Program, Graduate Program in English & Humanities, Digital Writing & Narrative Design Program, Language Minors
Social Media: Facebook | Twitter | LinkedIn | Instagram | YouTube
While I have been involved with the VHC––a non-profit organization the goal of which is to advocate for the humanities––since 2013, I became in 2016 the non-profit organization’s Web and Publications editor and a permanent member of the board. I am responsible for designing promotional materials, managing the print publication of our conference proceedings, maintaining contact lists, archiving annual conference materials, and developing and maintaining the website. In particular, I migrated from a hand-designed site to WordPress and spearheaded the integrated use of PayPal to systematize registration and registration fees. I served as the VHC President for 2015, hosting an annual conference that brought approximately 80 external speakers, presenters, and students.
Virginia Humanities Conference website
Social Media: Facebook | Twitter
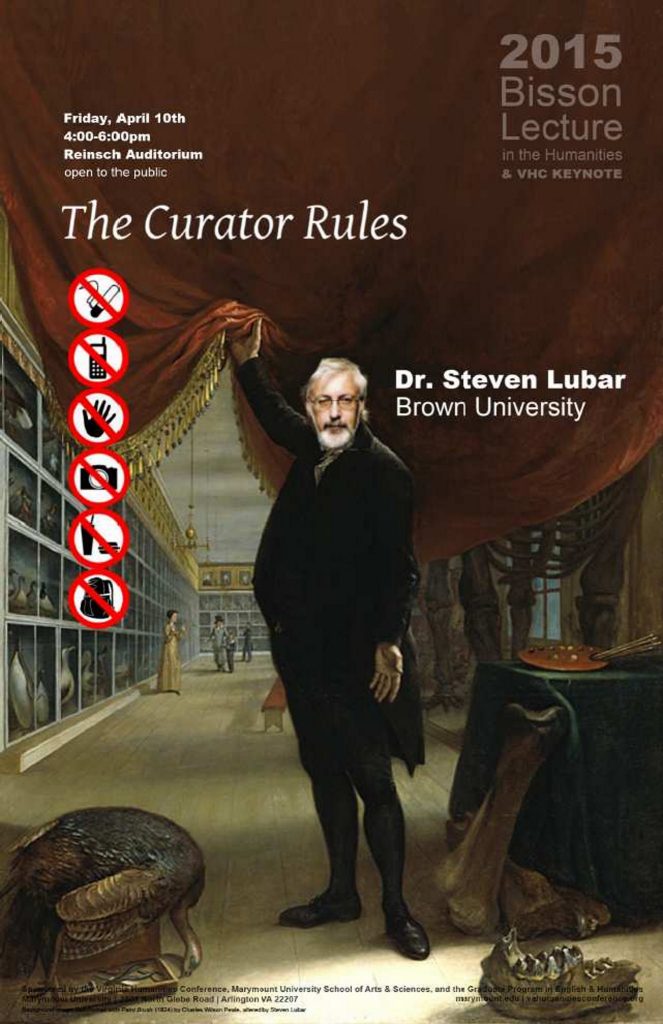
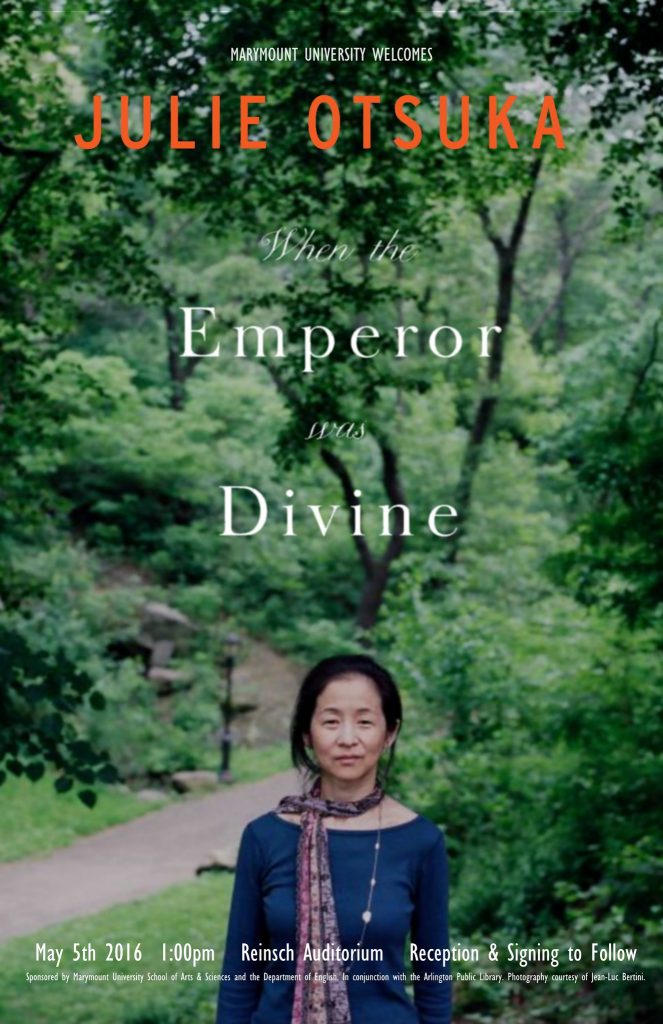
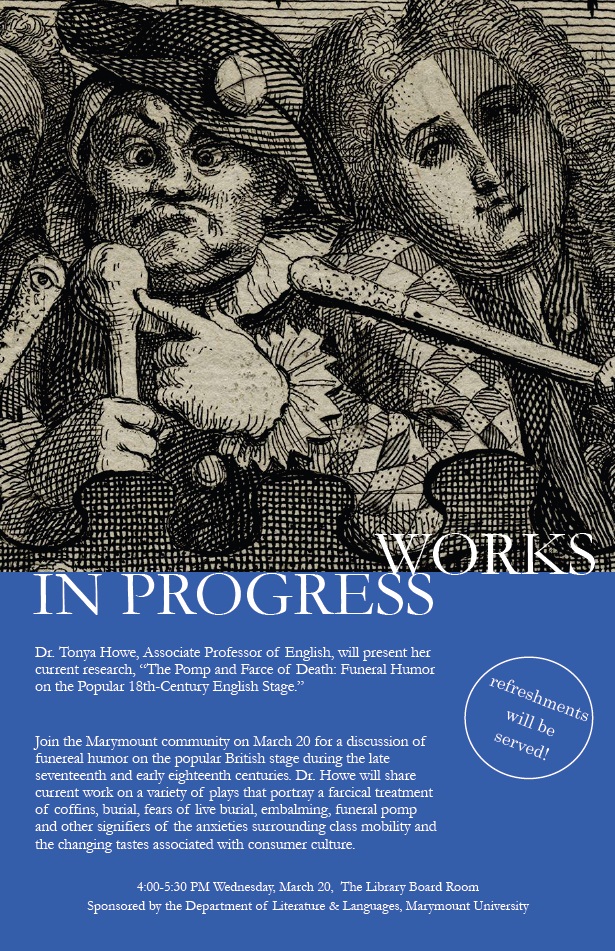
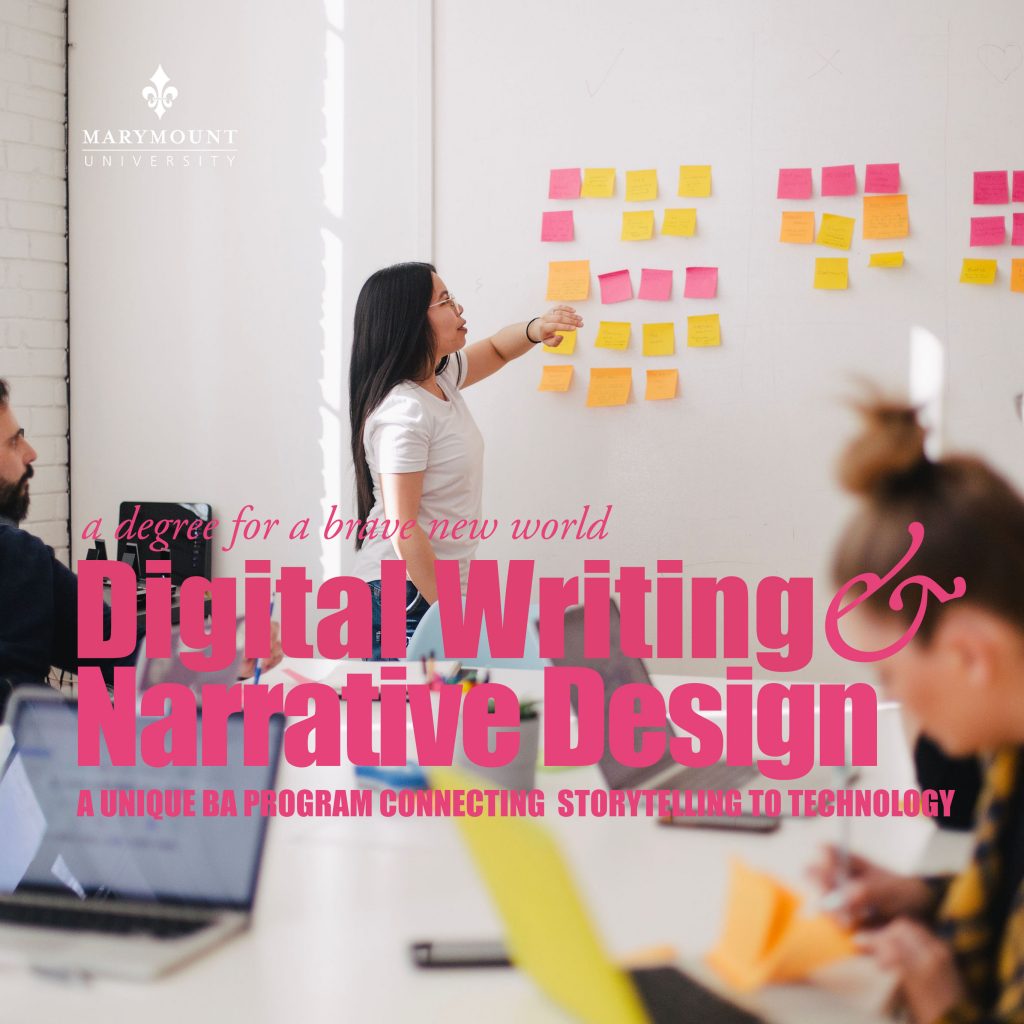
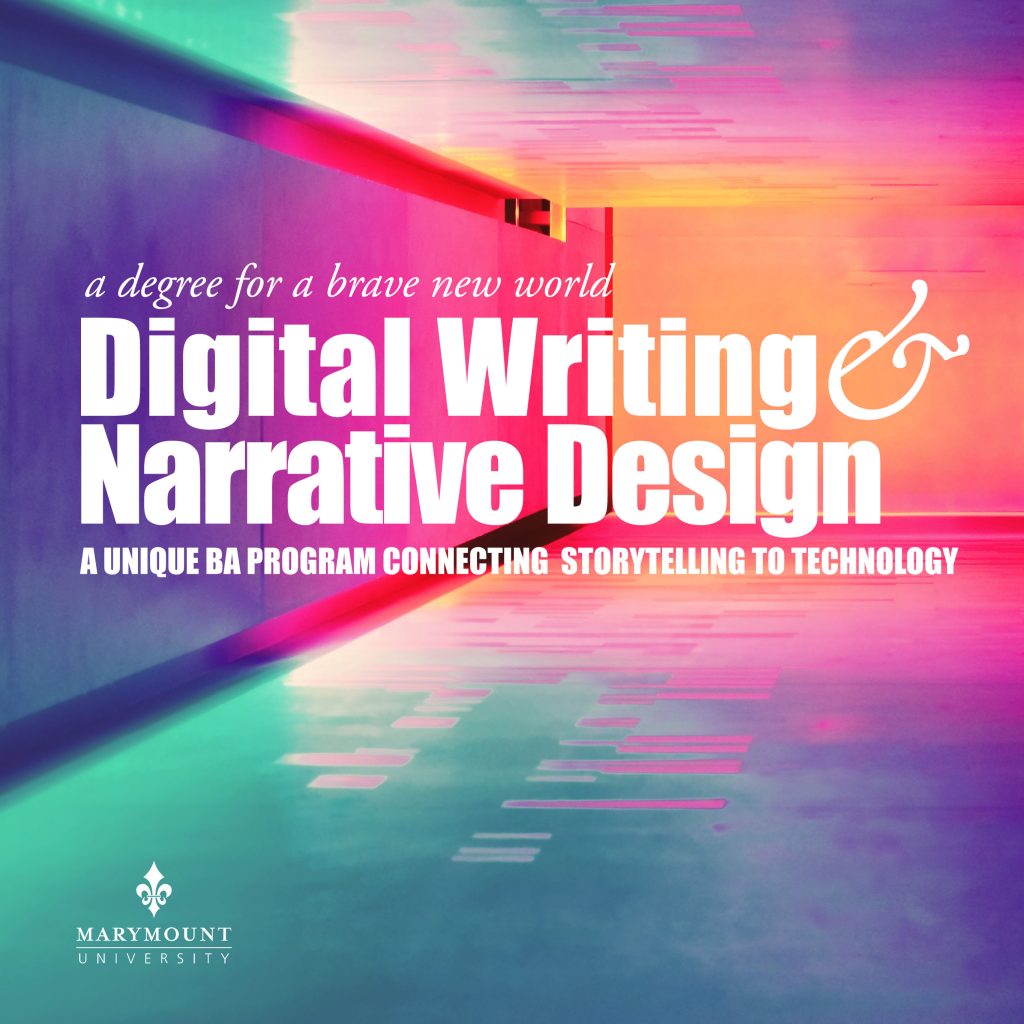
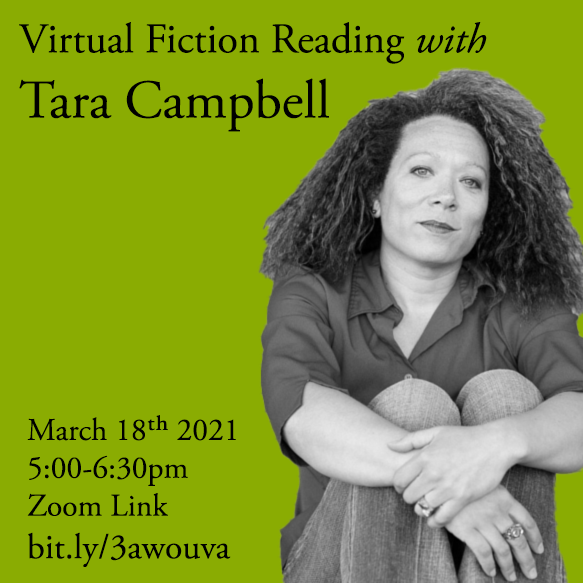
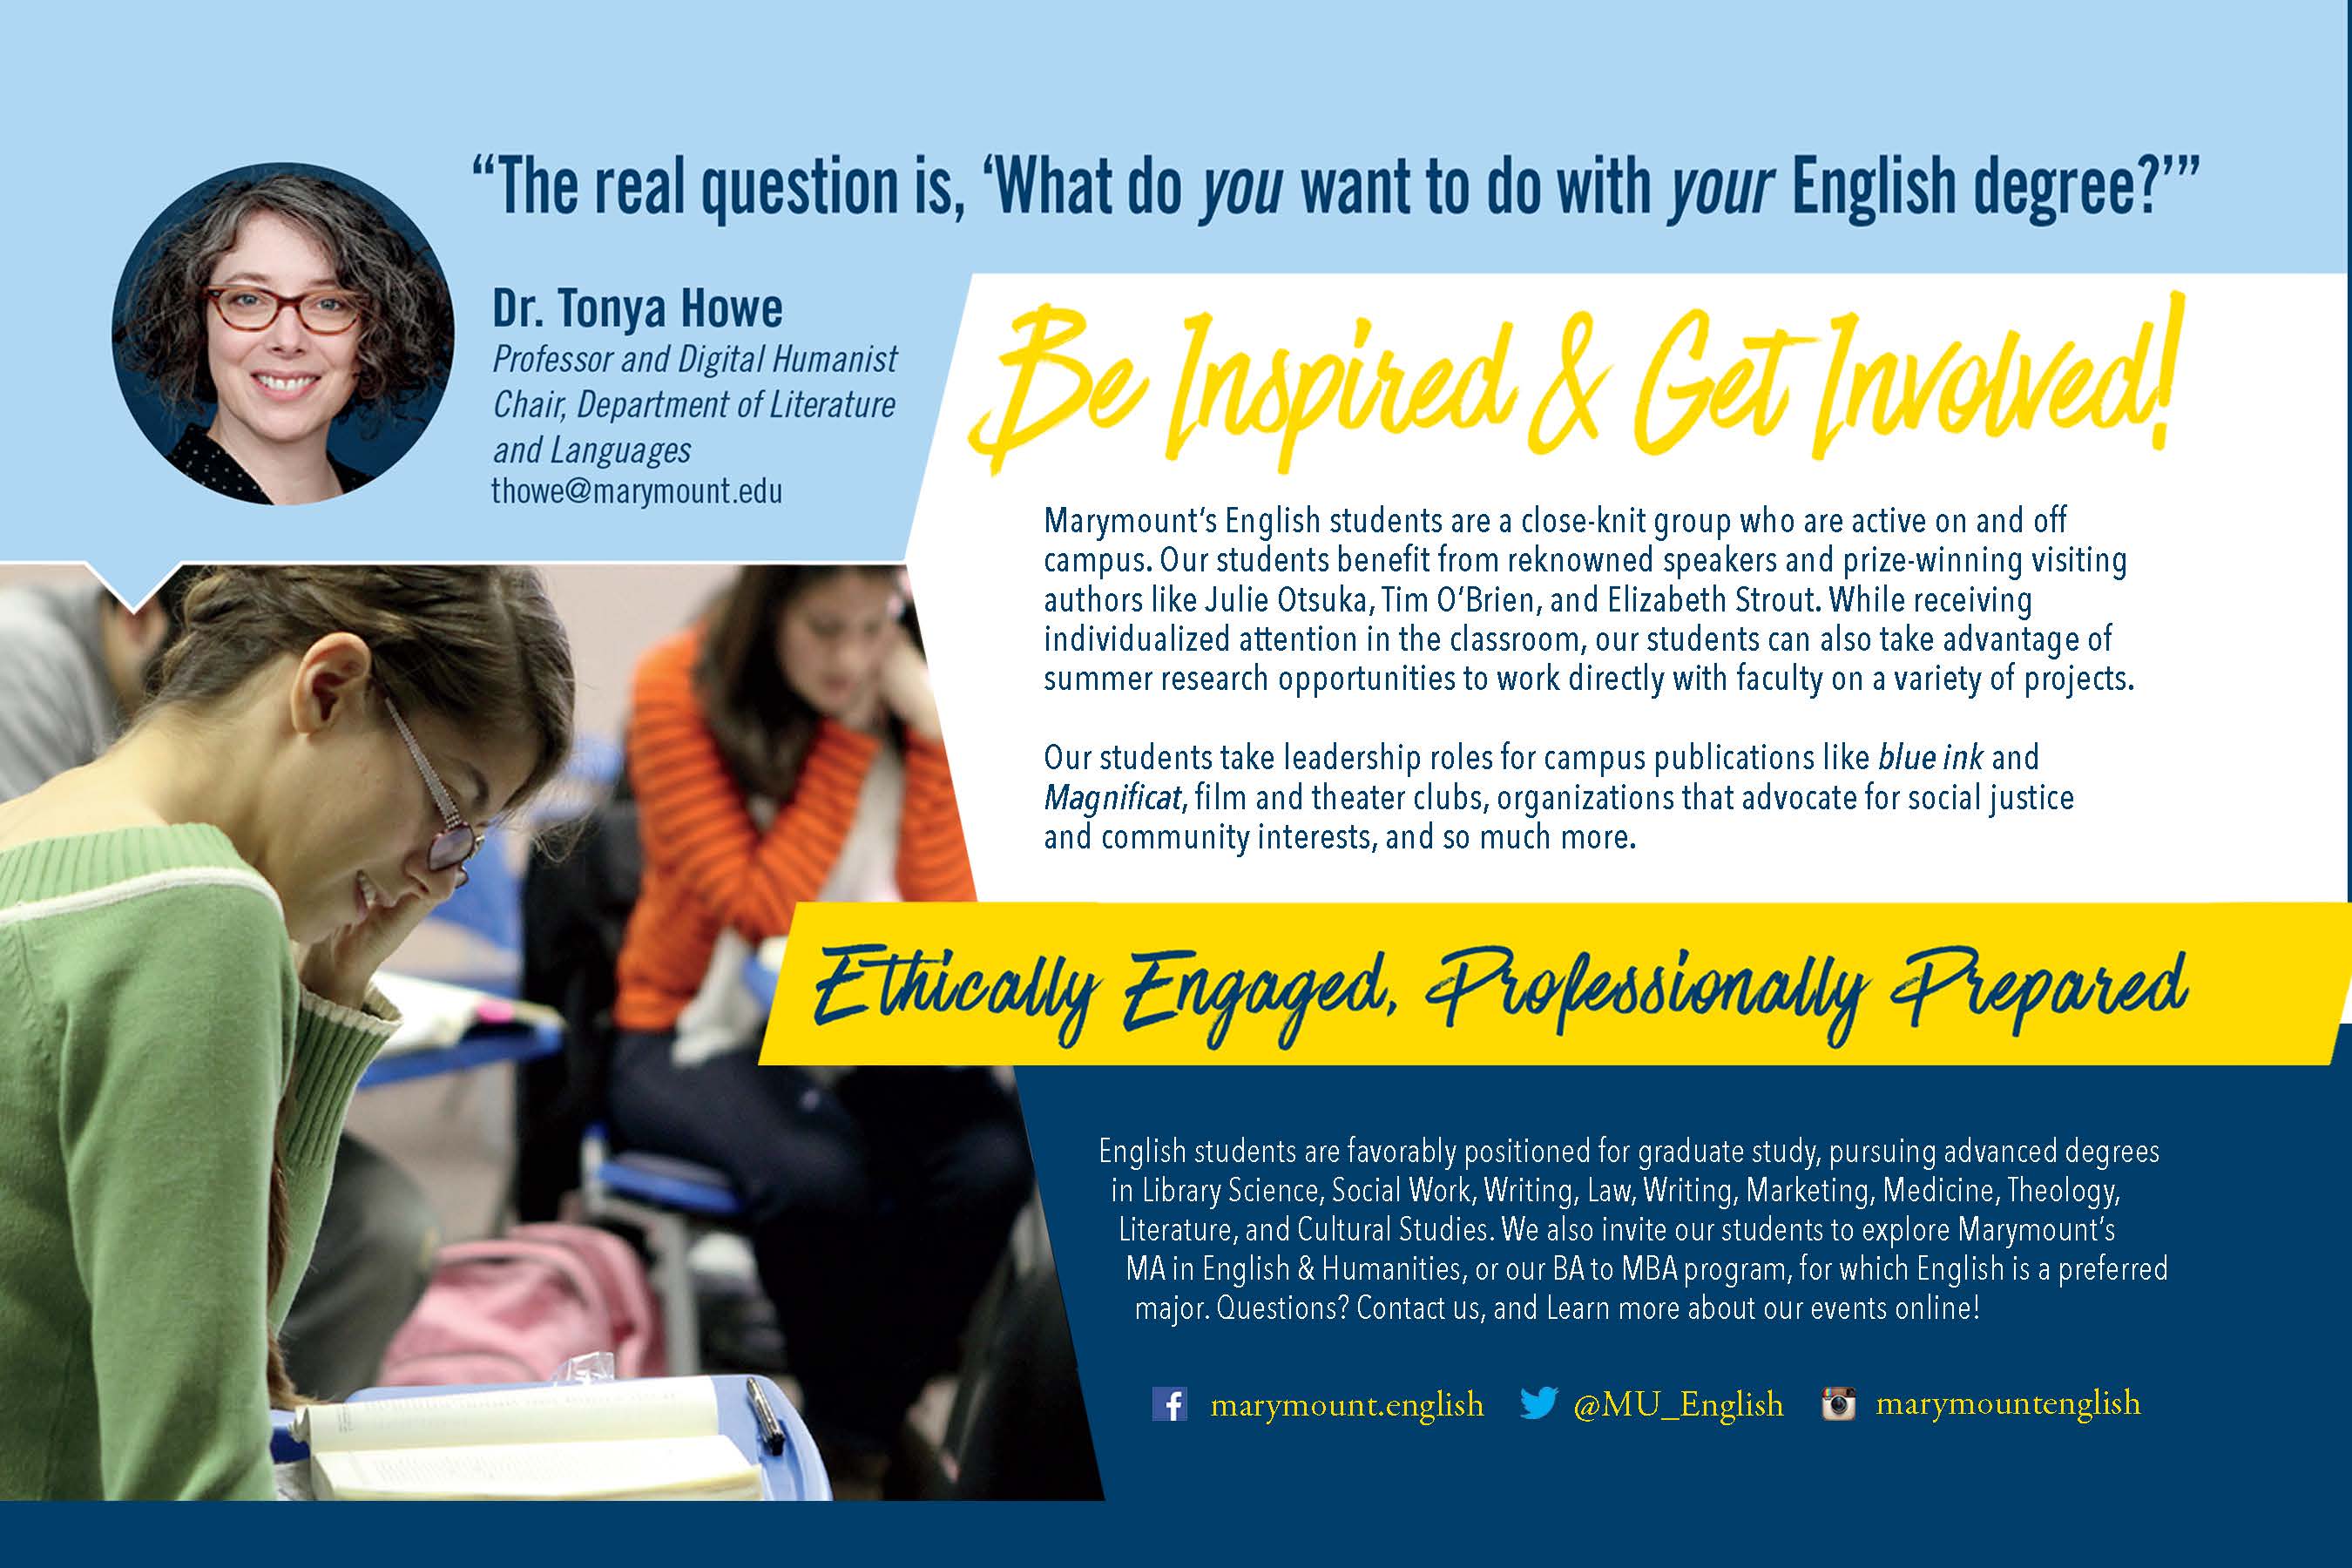
Sample Program & Event Advertising
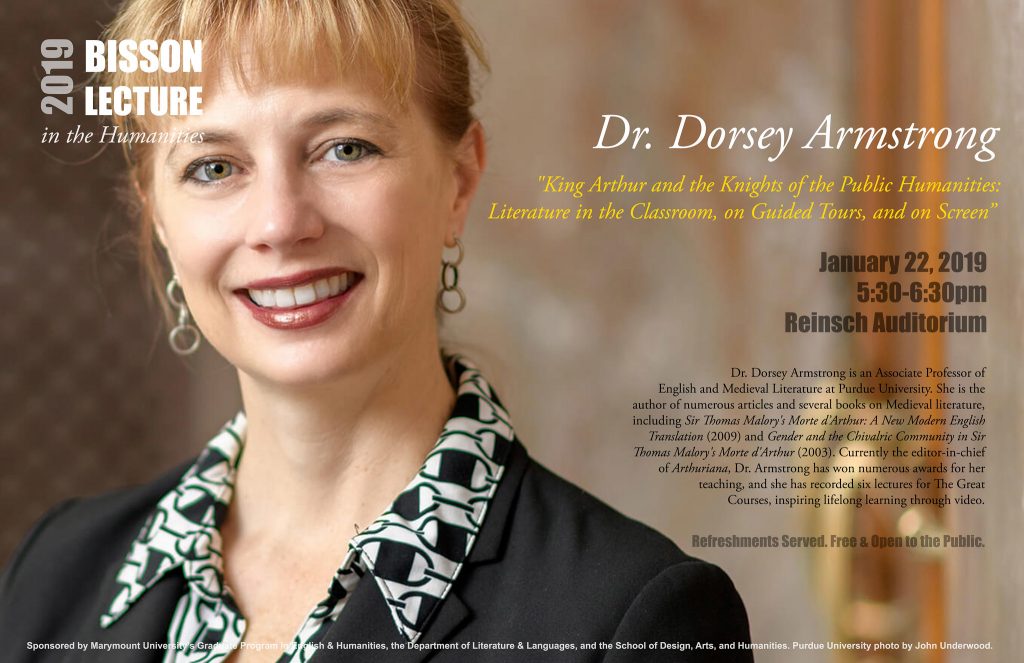
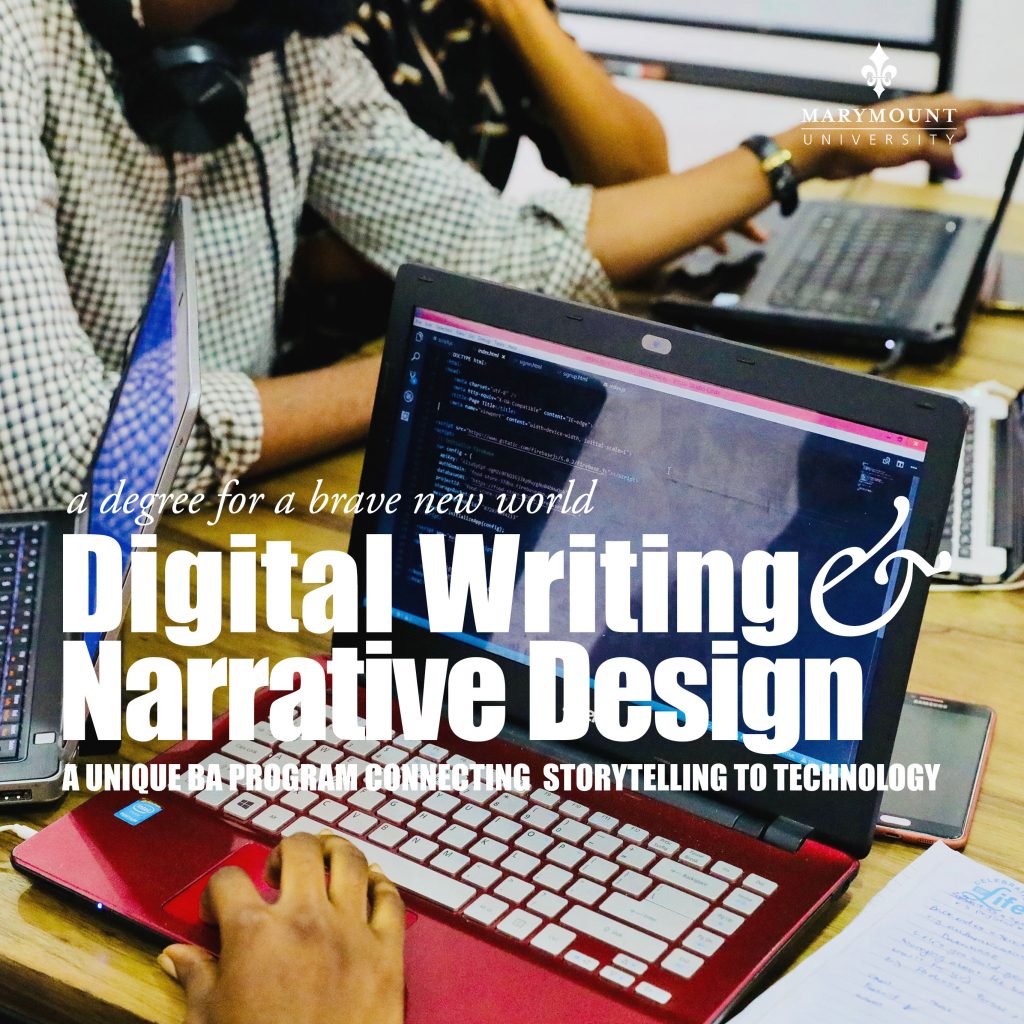
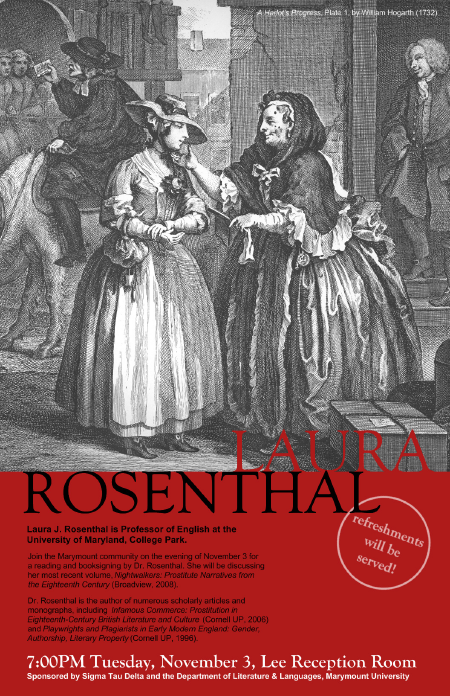
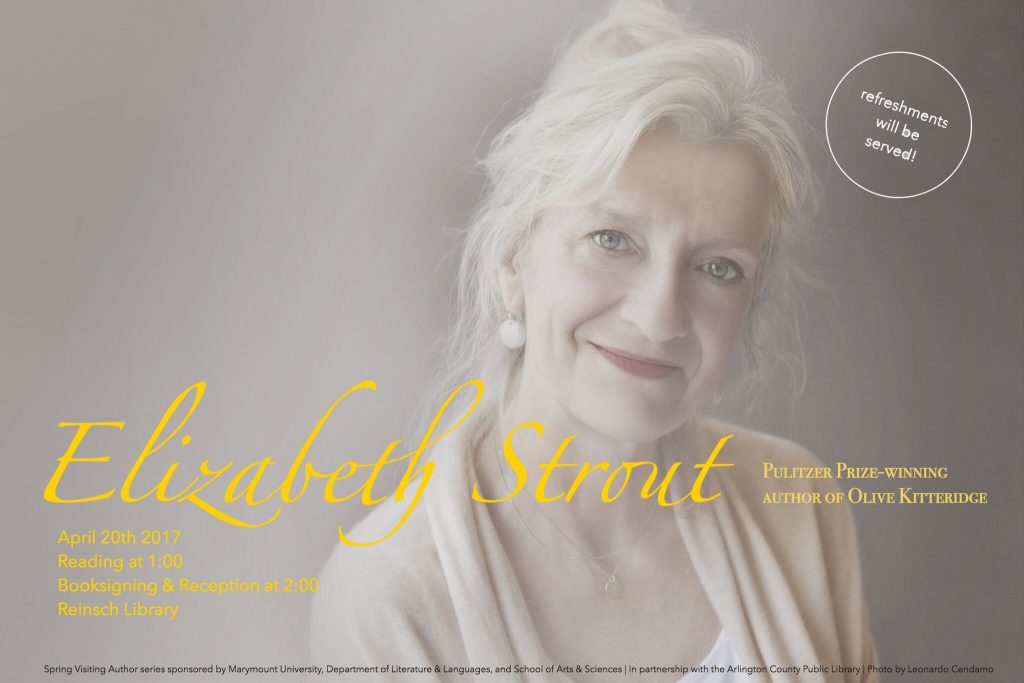
For the past decade, I have been responsible for designing our program event and publicity materials, including numerous print advertisements for visiting speakers and authors, some of which are available below. Print materials are primarily designed in Photoshop, while social media materials, a combination of Photoshop, Canva, and Befunky, a simple web-based design platform that integrates with social media and unlicensed image repositories like UnSplash.


Writing Samples
These samples illustrate the strength and flexibility of my writing in a number of different media and for a variety of audiences and purposes: blog posts, popular web essays, encyclopedia entries, visual stories, grant and project proposals at various stages of formality, assessment reports, and websites. Several of these pieces are co-authored. Want to see a single-authored academic essay? Sure! If you’d like to see something not represented here, please contact me. View writing samples here.
My research and writing spans a variety of registers; I am interested in late early modern and 18th century literature and cultural studies, especially popular performance genres; this is the hinge to my other passion, horror film as a popular, self-conscious performance genre. I am also deeply engaged in digital humanities and have written on any relevant topics, focusing on the practical and the pedagogical.
Blog Posts/Public Writing
“Open Anthologies and the Eighteenth-Century Reader.” Co-authored with John O’Brien. The Eighteenth-Century Common. 27 June 2016. <http://www.18thcenturycommon.org/anthologies>.
“Teaching Carnival 5.05” ProfHacker: Tips about Teaching, Technology, and Productivity. The Chronicle of Higher Education. 9 January 2012. Web.
“Teaching Carnival 5.01” ProfHacker: Tips about Teaching, Technology, and Productivity. The Chronicle of Higher Education. 1 September 2011. Web.
“Seeing the Trees in the Forest: Teaching Literature with Data Visualization Techniques.” Journal for the Liberal Arts and Sciences (Fall 2008): 43-61.
Encyclopedia Entries
“Love in Excess; or, The Fatal Enquiry.” The Literary Encyclopedia. 28 January 2020. <https://www.litencyc.com/php/sworks.php?rec=true&UID=19707>.
“Eliza Haywood,” The Literary Encyclopedia. 01 November 2016. <http://www.litencyc.com/php/speople.php?rec=true&UID=2047>.
“City Lights.” Movies in American History: An Encyclopedia. Ed. by Philip DiMare. 3 vols. Greenwood: ABC-CLIO, 2011.
“The Silent Era.” Movies in American History: An Encyclopedia. Ed. by Philip DiMare. 3 vols. Greenwood: ABC-CLIO, 2011.
Pedagogical and Scholarly Writing
“Non-Fatal Inquiry: Love in Excess, Print, and the Internet Age,” Approaches to Teaching Eliza Haywood, ed. by Tiffany Potter. Modern Language Association of America, 2020. 196-203.
“WWABD?: Intersectional Futures in Digital History.” ABO: An Interactive Journal for Women in the Arts, 1640-1830. Fall 2017. <http://scholarcommons.usf.edu/cgi/viewcontent.cgi?article=1166&context=abo>.
“Getting Lost in the Digital Archive.” Review of the database Eighteenth-Century Drama: Censorship, Society, and the Stage, Adam Matthew, Sage Publishing. 2016. Restoration and Eighteenth-Century Theatre Research. 31.1 (Fall 2017): 133-136.
“Making a New Kind of Modern: On the Arts in the Age of Anne,” titled essay-review of Queen Anne and the Arts. In Eighteenth-Century: Theory and Interpretation 58:4 (Winter 2017). 497-502.
“Crawlspace and the Kinski Swerve,” Klaus Kinski, Beast of Cinema. Ed. by Matthew Edwards. Jefferson, NC: McFarland Press. 2016. 140-160.
“’All Deform’d Shapes’: Figuring the Posture-Master as Popular Performer in Early Eighteenth-Century England.” Journal of Early Modern Cultural Studies 12.4 (Fall 2012): 26-47.
“Teaching British Women Playwrights of the Restoration and Eighteenth Century (review).” Restoration: Studies in English Literary Culture, 1660-1700 36.1 (Spring 2012): 66-70.
“Abject, Delude, Create: The Aesthetic Self-Consciousness of Early Eighteenth-Century Farce.” Restoration and Eighteenth-Century Theatre Research 25.1 (Winter 2011): 25-45.
“Taking the Coquette Seriously.” Eighteenth-Century: Theory and Interpretation (July 2011, Online Supplement).
Report Writing
In higher education, the ability to communicate across campus, develop reports that speak to your strengths, and imagine improved futures is essential. Here are three sample reports and proposals I have written.
Outcomes Assessment Report (Biennial)
