
I have been a big fan of small multiples ever since I learned how to make them–at some point, the enjoyment I take in seeing them come together will fade, but for now, I’m all in. A friend (hi, Tina!) recently asked how I got small multiples into the static viz, and I thought this would be a great third post.

In a nutshell, I used Tableau and Illustrator–Tableau to create the small multiples, and Illustrator to format them. But, turns out that Tableau has some idiosyncrasies in the export process. Who knew?
Step 1: Create the small multiples
Create your small multiples in Tableau–I created two sets, one for horror films produced by country as a proportion of all film produced by country. I opted for donut charts, because I wanted to embed another set of small multiples inside the first. You’ll need the column and row calculations, as you’d expect, and then a filter on Measure Names to select the Count of Horror and the total Films. If you want to order the donuts in a particular way that’s not alphabetical, also add a filter on Country and sort on that. I didn’t need it. Anyway, this is what it should look like. You can learn more about creating donuts with this Doing Data post, and for small multiples, check out the Flerlage Twins’ detailed explanation here or this explanation from Nightingale on Medium.
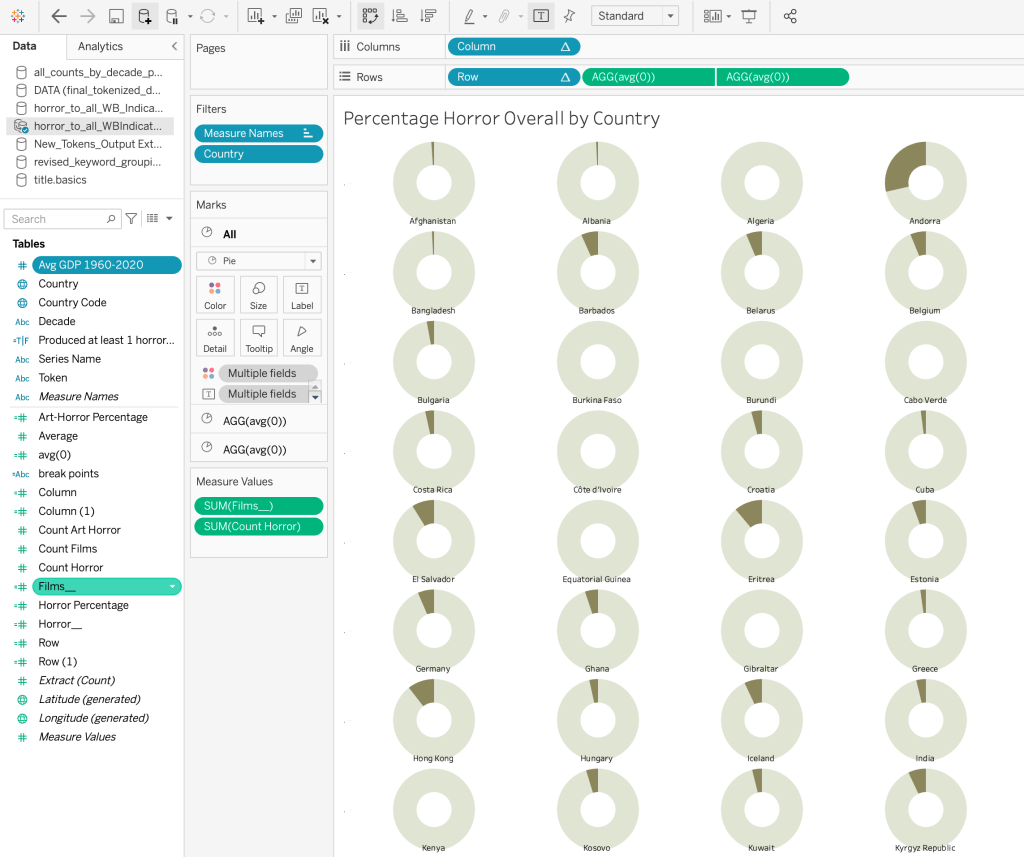
I was having a lot of problems at first with my proportions just not looking correct. Obviously, you need to include the items you’re comparing in your donuts, but because some countries in my dataset didn’t have film industries at all, or no horror films, or no horror films about art, those observations came in as nulls. So (thanks, Louis!), I needed to use the ZN function to replace nulls with zeroes, and then get an accurate number of the total films.

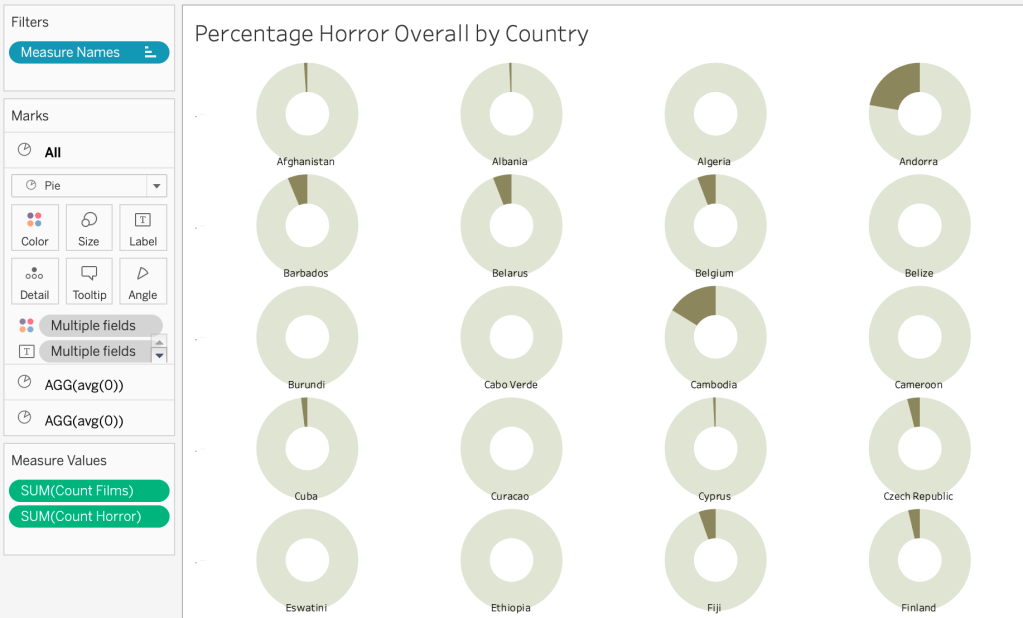
Without this calculated field, all of the proportions were off–a country that had clearly more than 25% of its films in the horror genre didn’t look like over a quarter were in that category. I think the data was getting shifted over to fill in the nulls with adjacent data (but totally not sure of this–if you know why, let me know!). This is what the donuts looked like with just the raw Count of all Films in place of the ZN calculation–note that Andorra’s 29% registers as below a quarter–that’s what tipped me off!
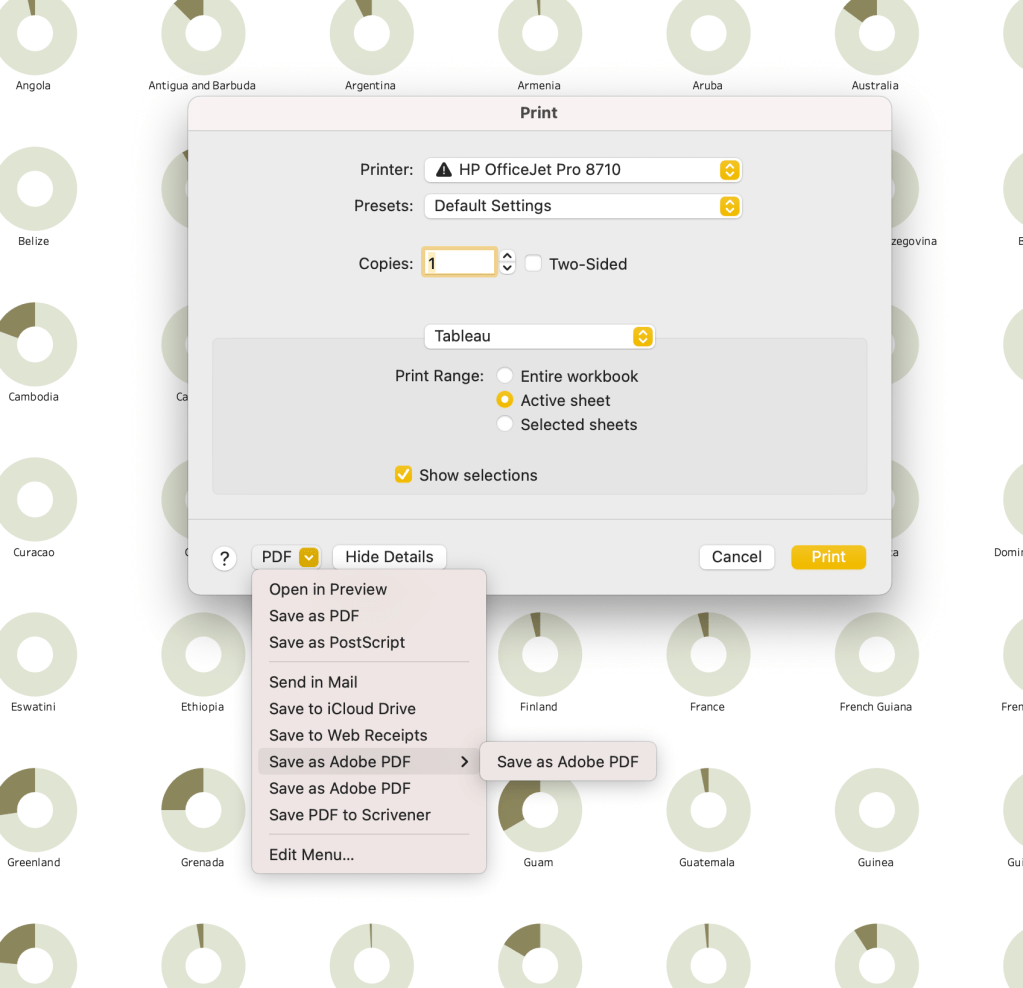
Step 2: Save as Adobe PDF
Anyway, once you have your small multiples, put the sheet into a dashboard and then save the dashboard (the active sheet) as an Adobe PDF:
This will put all your small multiples, as you’ve organized them, into a single PDF. If you only save the worksheet, you’ll get many pages, making your work in Illustrator much more complicated. This is what it looks like when you import a worksheet vs a dashboard into Illustrator:

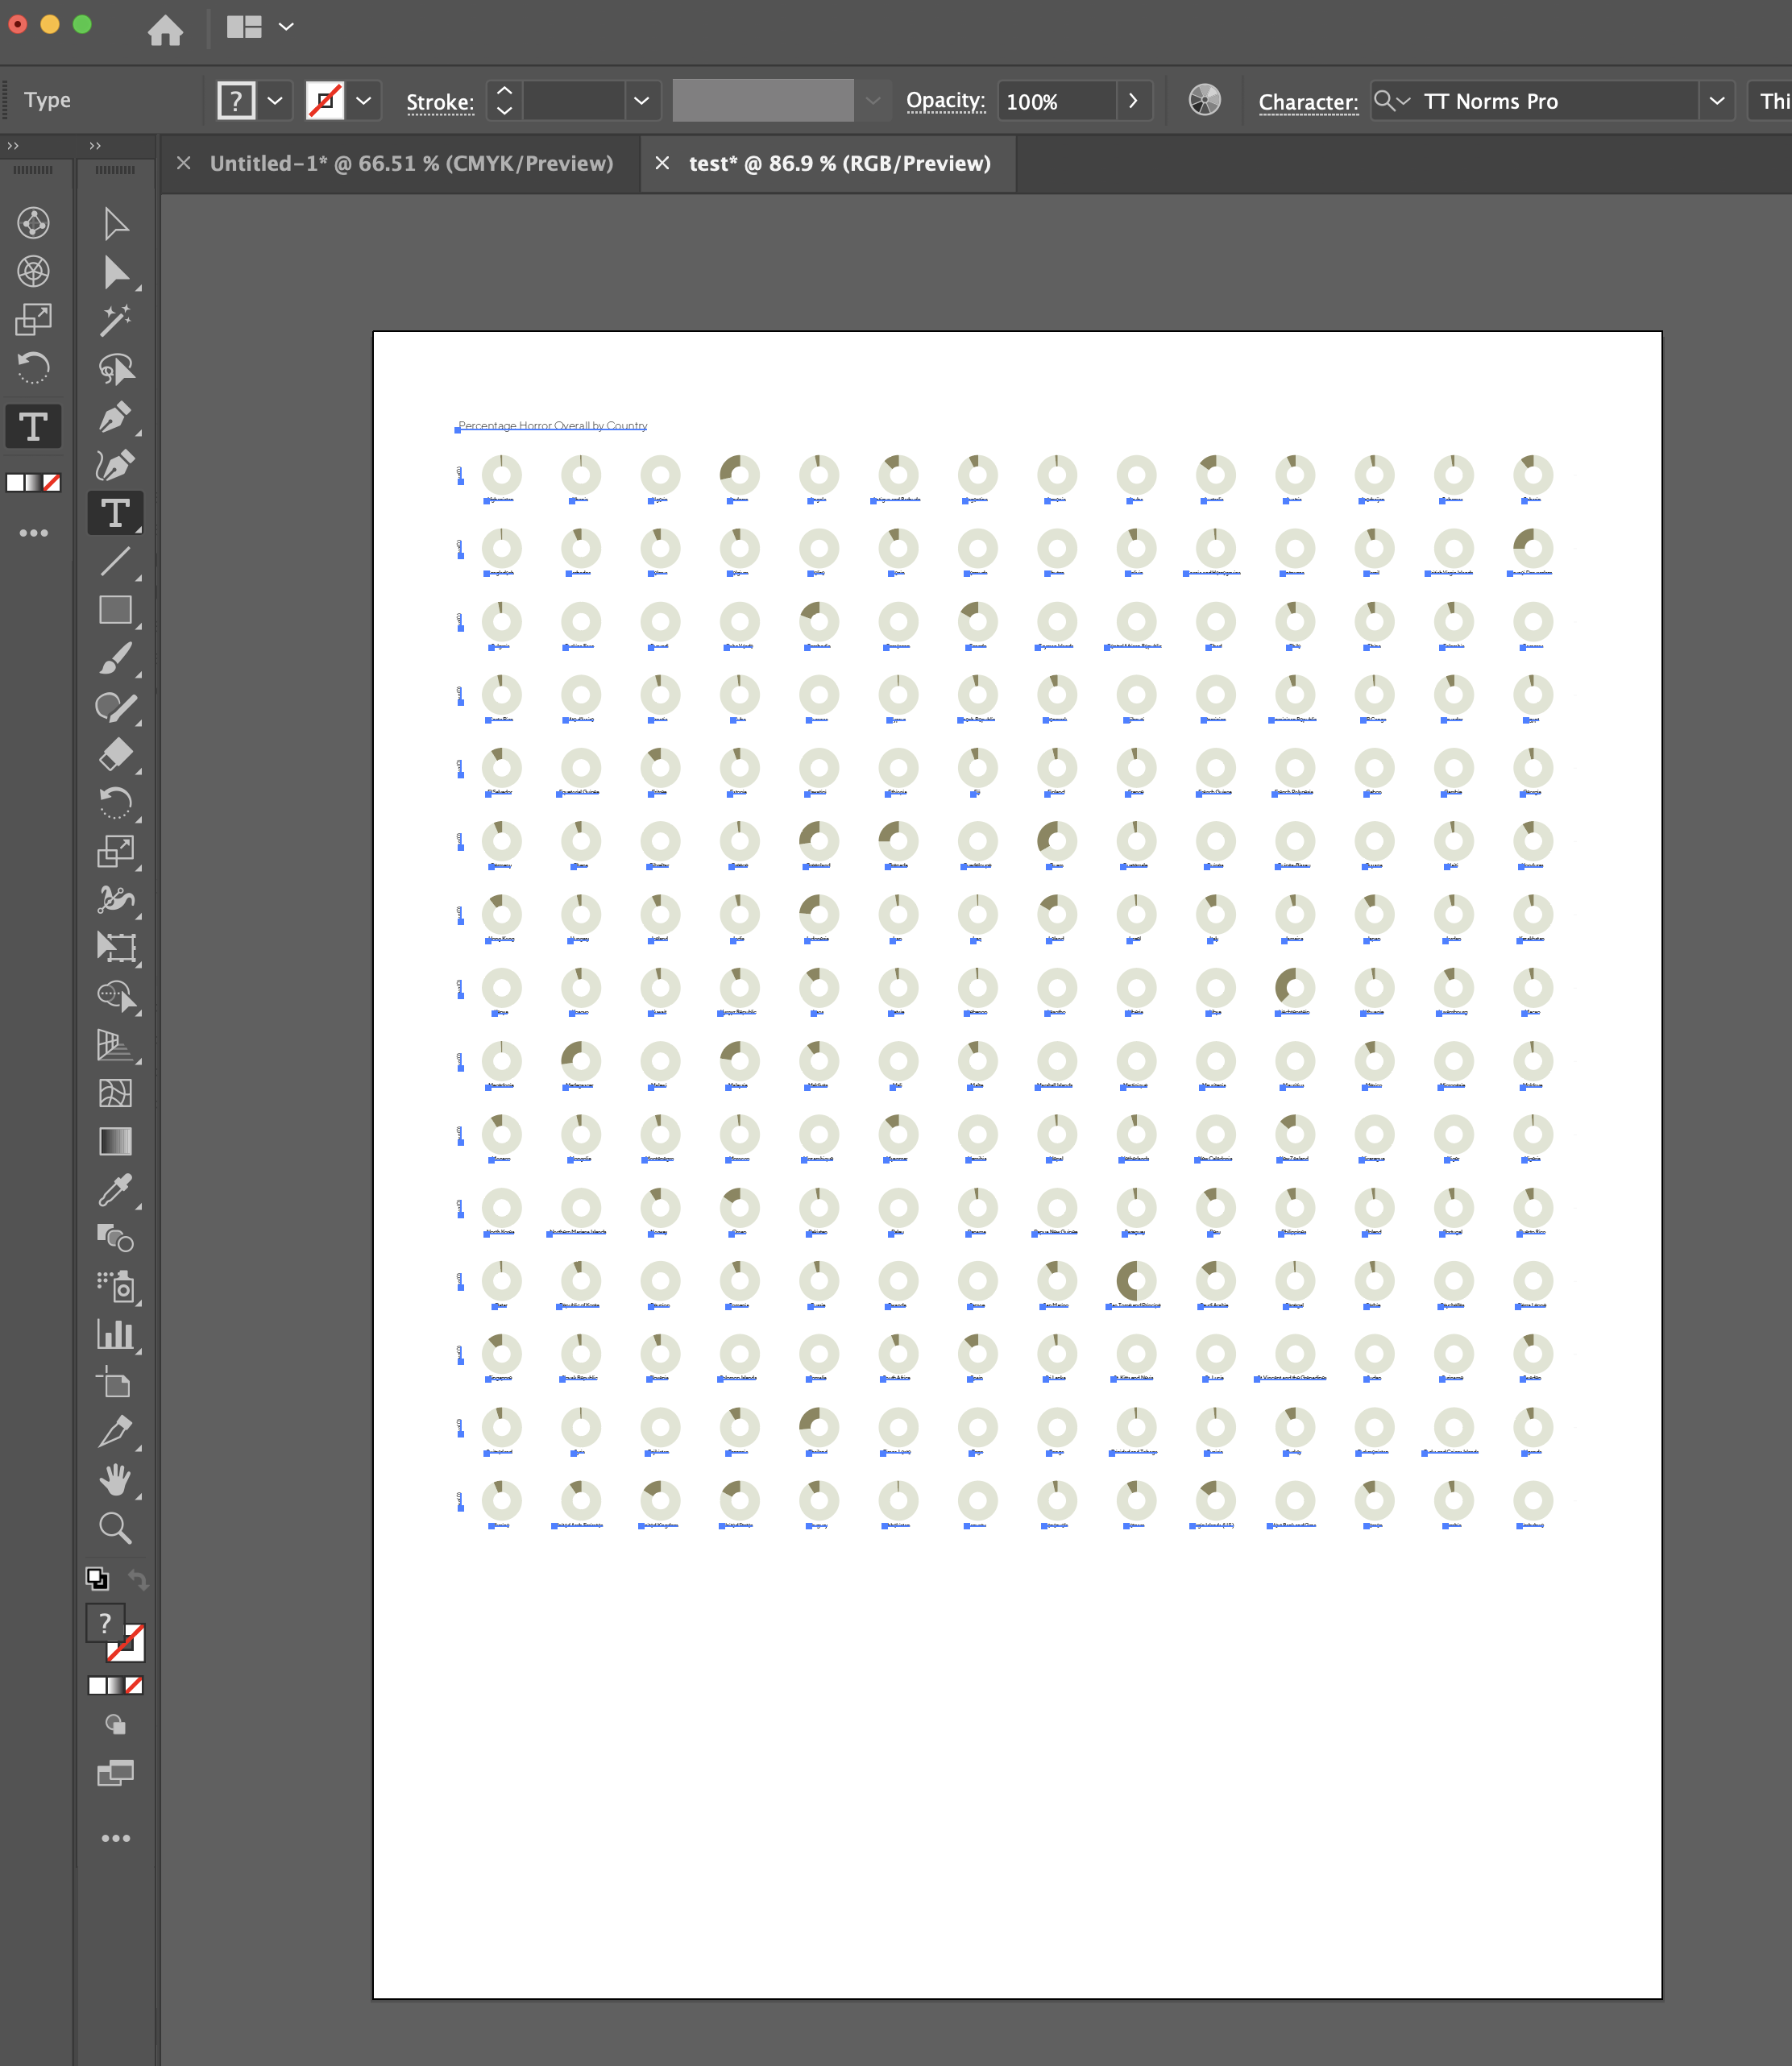
You may still have to do some re-organization to make your small multiples fit into the parameters of your print project, but this is a lot easier if you’ve got a nice, clean layout to start with.
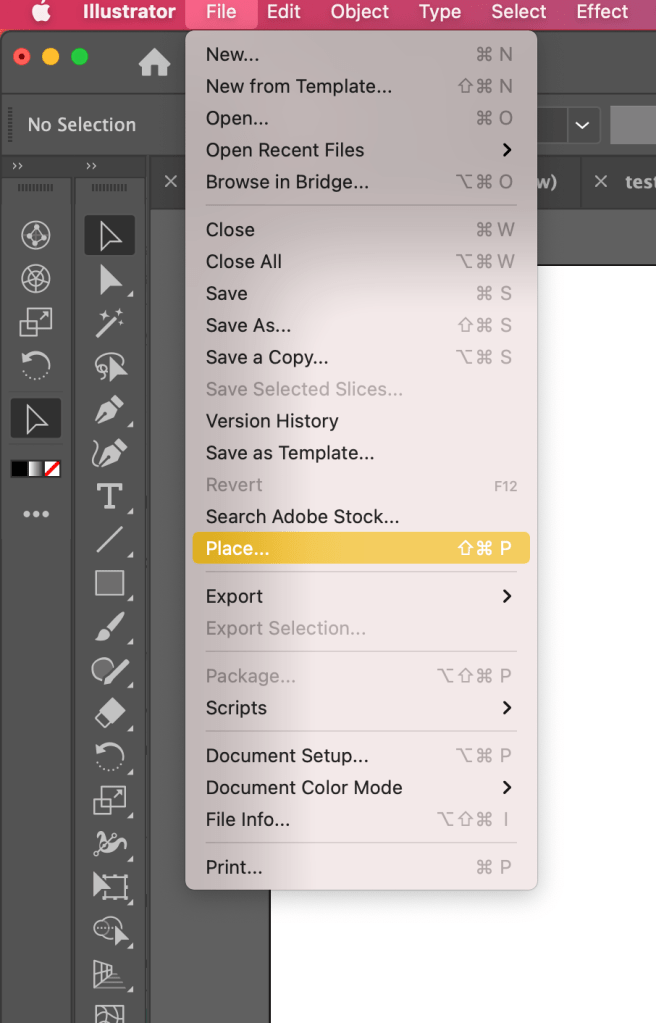
Step 3: Open or Place in Illustrator
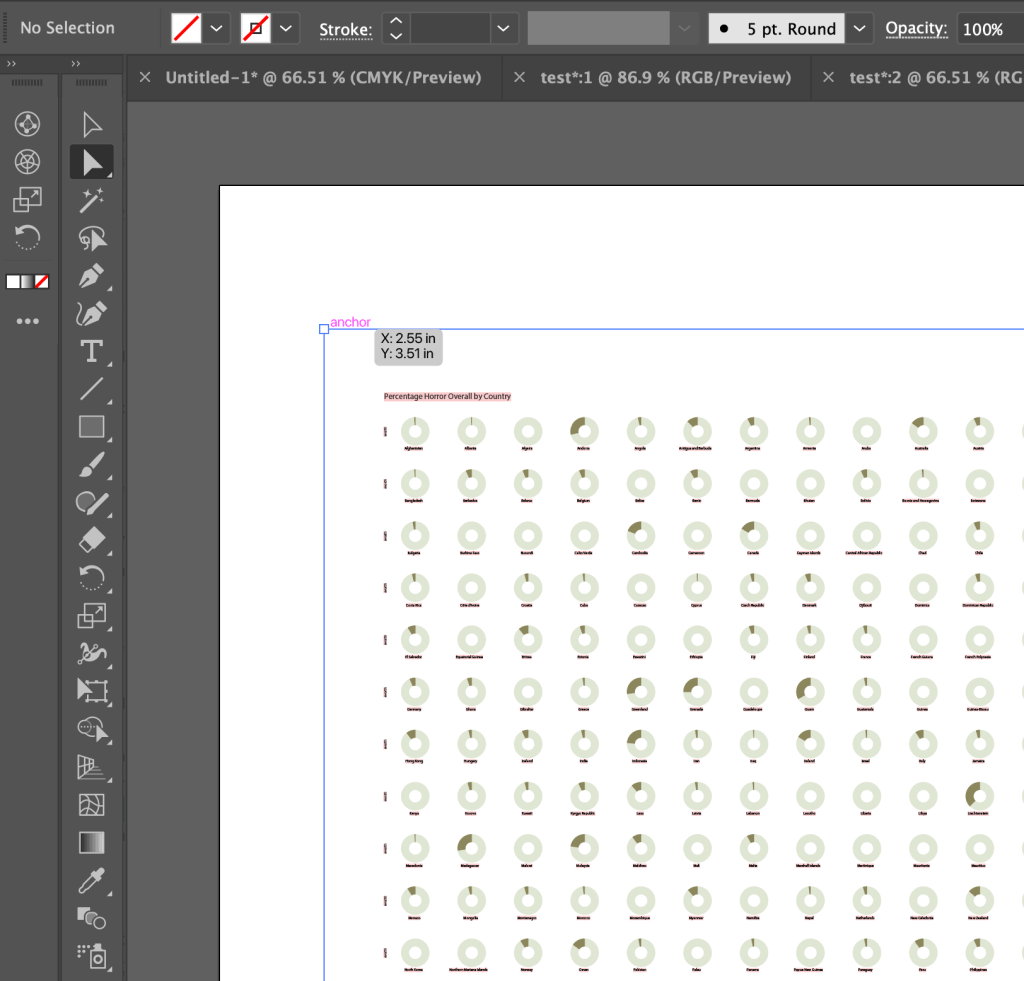
To get your small multiples into Illustrator, you can either open directly from within Illustrator, select what you want to use, and copy that into your working document, or place your PDF directly into your working document.
Step 5: Whittle down to what you want
When the PDF comes in, you’ll note that it has lots of extra marks–in wireframe (CMD-Y) you can see this junk. All the black lines are lines or boundary boxes in your document:

To remove the marks you don’t want, you’ll need to use the Direct Select tool (A). Directly select the top corner anchor of the outermost box, for instance, and delete it. Don’t freak out if you see half of your multiples disappear! You’re only deleting the extra objects, and the vector object that remains after you delete one corner is now a triangle. Keep deleting those anchors to delete the extra stuff. If you inadvertently select with the regular selection tool (V)–the outline arrow tool, instead of the filled arrow tool–you can just undo with CMD-Z.
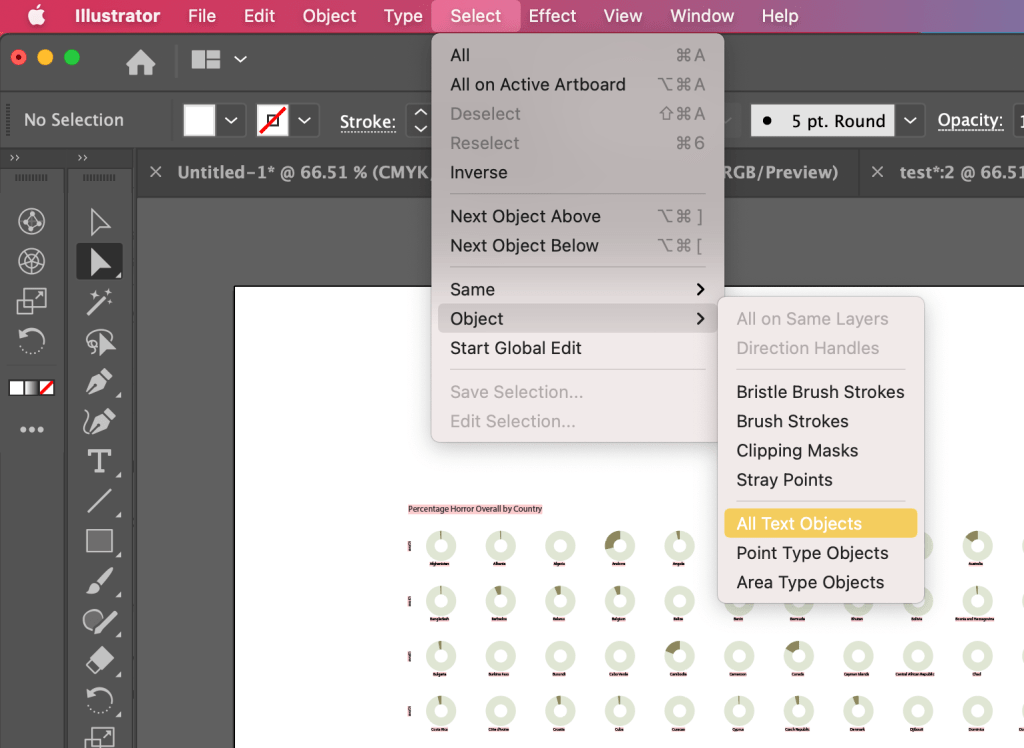
You can delete the x and y axis labels, the title label, and so on, too. Note that to manipulate individual donuts, you’ll have to group them. You can also select by fill or outline color, opacity, and object type, which will make your work in Illustrator easier:

That’s basically it–the rest is design. The Internet has tutorials for almost anything you could want, and there are community forums for almost any software platform you can imagine, so don’t be shy–google and ask away. I asked for a lot of help on the way (hi, Xime!).
Have fun!
