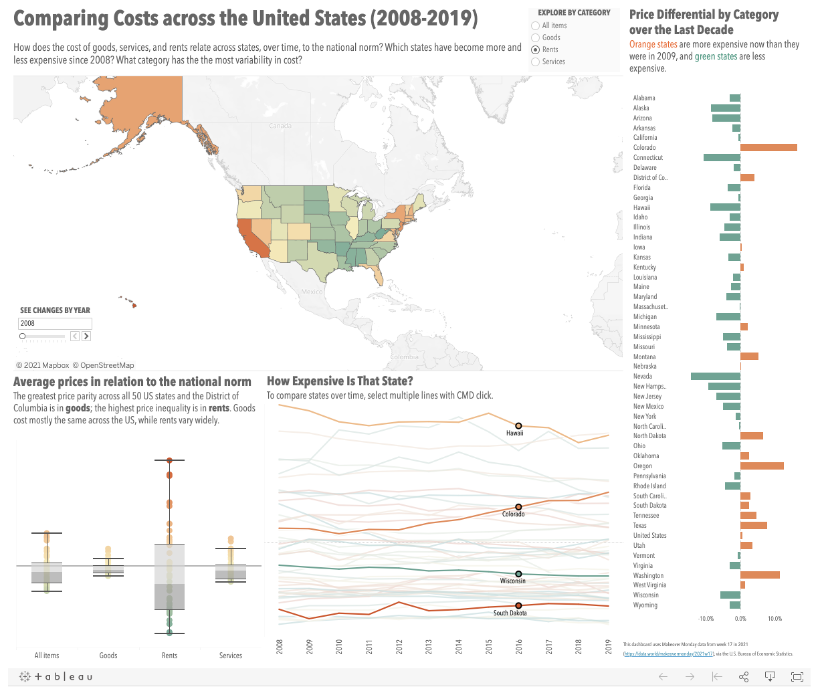
I used Makeover Monday data for this project, specifically the “Price Parity” data from week 17 of this year. The data comes from the US Bureau of Statistics and shows overall rent, goods, and services prices across the 50 US states and DC from 2008-2019. It does not have good granularity; all the data is at the state level. In another iteration of this, I might want to pull in deeper geographic and price data, and perhaps overlay that with information on cost of living and income, but for now, I am satisfied with this topic and data.
The original visualization used a circular bar chart to show states by “chunk” of cost. All the data is related to the overall US norm/average, which is set to 100, so states are either above that norm (i.e. 105) or below that norm (i.e. 81). It did not allow any interactivity and accomplished basically one thing—overall cost comparison by state. I wanted to break the data down a bit more and visualize both the geographic area and the different kinds of price categories over time, so I first created a map that was sortable by price category and by year. I also created a candlestick/bar-and-whisker chart plotting each state on price category. This is useful because it shows outliers and norms, and it makes it very clear how much variation there is in rents versus goods across states. I also wanted users to be able to compare states, and to see how much the states had increased or decreased in price since 2008. To accomplish these goals, I created two more charts—one, a line chart with all 50 states (I know, I know!), and two, a bar chart showing increase and decrease in percentage of cost between 2008 and 2019 (the beginning and endpoints of the data). The map is probably the chart type that is actually less useful, because between the years, the prices don’t vary much—as a result, the colors are only slightly different and not very evident. The line chart with all 50 states I think is very well-suited for this, despite the possibility for cognitive overload, because 1.) it can be focused (like all the charts) by category type; as a result, you can see very clearly the same data in the box and whisker chart, but over time, rather than an average. 2.) A user can select states to highlight and compare by using CMD click. 3.) I used the same palette for the states, which repeats, and did not label anything other than the years; hovering, however, shows you which state you’re on. And 4.) I also set the view to load highlighting four states in the line chart, to model the interactivity. The price differential chart was useful because it showed very clearly by what percentage in any given category the prices had gone up or decreased. I really wanted users to be able to select states to focus on in the line chart by multi-selecting from the price differential chart, but this proved too complicated for me at this point. I used a color palette from Carto called Geyser, and this gave me a limited palette that was diverging but also earthy (to suit the map) and somewhat related to red and green (to suggest high and low cost).
My calculations were limited, but targeted for readability. I created three calculated fields, though I experimented with many others. After doing a lot of work, I realized that the best way to get the percent of national average was basically just to subtract 100 (the stable number used in the data for the national norm) from the state’s cost–% of National Average = SUM([Values by Year]-100). It seems really simple, but it worked well! I also spent some time trying to figure out how to do high/low tests—Hi Low Test = IF [% of National Average] > 0 THEN “above” ELSE “below” END and Cheaper? = IF (ZN(SUM([Values by Year])) – LOOKUP(ZN(SUM([Values by Year])), -1)) / ABS(LOOKUP(ZN(SUM([Values by Year])), -1)) > 0 THEN “more expensive” ELSE “cheaper” END–which I then incorporated into different charts (tooltips and coloring, especially in the bar and whisker and in the price differential bar chart). I also did a simple percentage that I thought would allow me to make the tooltips even clearer—so instead of -14% of national average, I would have something like 14% below the national norm. That was achieved by Simple Percentage = ABS([% of National Average]). I don’t think I ended up using that one, because sometimes the tooltips just didn’t show up and I’d have to reset everything (what’s up with that, by the way?).
I sought to make this a dashboard that might work well in a newspaper or magazine like The Economist, so I used clean, san-serifed fonts and tried to incorporate space as well as a limited color palette. I ended up setting the category type to change all worksheets except the box-and-whisker chart. The year filter is set into the map, suggesting that it only pertains to the map. I struggled with where to put the filter panes and how to connect them to different parts of the worksheet without overloading things. Ultimately, this is why I didn’t allow users to select states for the line chart by, for instance, a drop-down menu. I do worry that the instructions for operation may be a little too terse, but I think it reads pretty well overall—it does seem very clean to me as a result of the color palette and choice of font.
Tableau Dashboard: https://public.tableau.com/app/profile/tonya.howe/viz/PriceParity_16235338340990/ComparingCostsacrosstheUnitedStates2008-2019

